Churn analytics
Last verified 2026-09-18
Analyze historical churn impacts on recurring revenue, evaluate churn reason distributions, monitor monthly ARR loss trends, and track all-time lost ARR.
Before you start
- ValueRamp Finance role
The Churn Analytics dashboard (/analytics/churn) provides the executive Finance view of customer and revenue attrition. By translating offboarding events into concrete financial impacts, this workspace enables commercial operators to analyze how much Annual Recurring Revenue (ARR) has been lost all-time, evaluate peak cancellation months, and diagnose the underlying business drivers behind customer departures.
Key capabilities
- Cumulative attrition tracking: Monitor total Churned Accounts and cumulative ARR Lost all-time across the workspace.
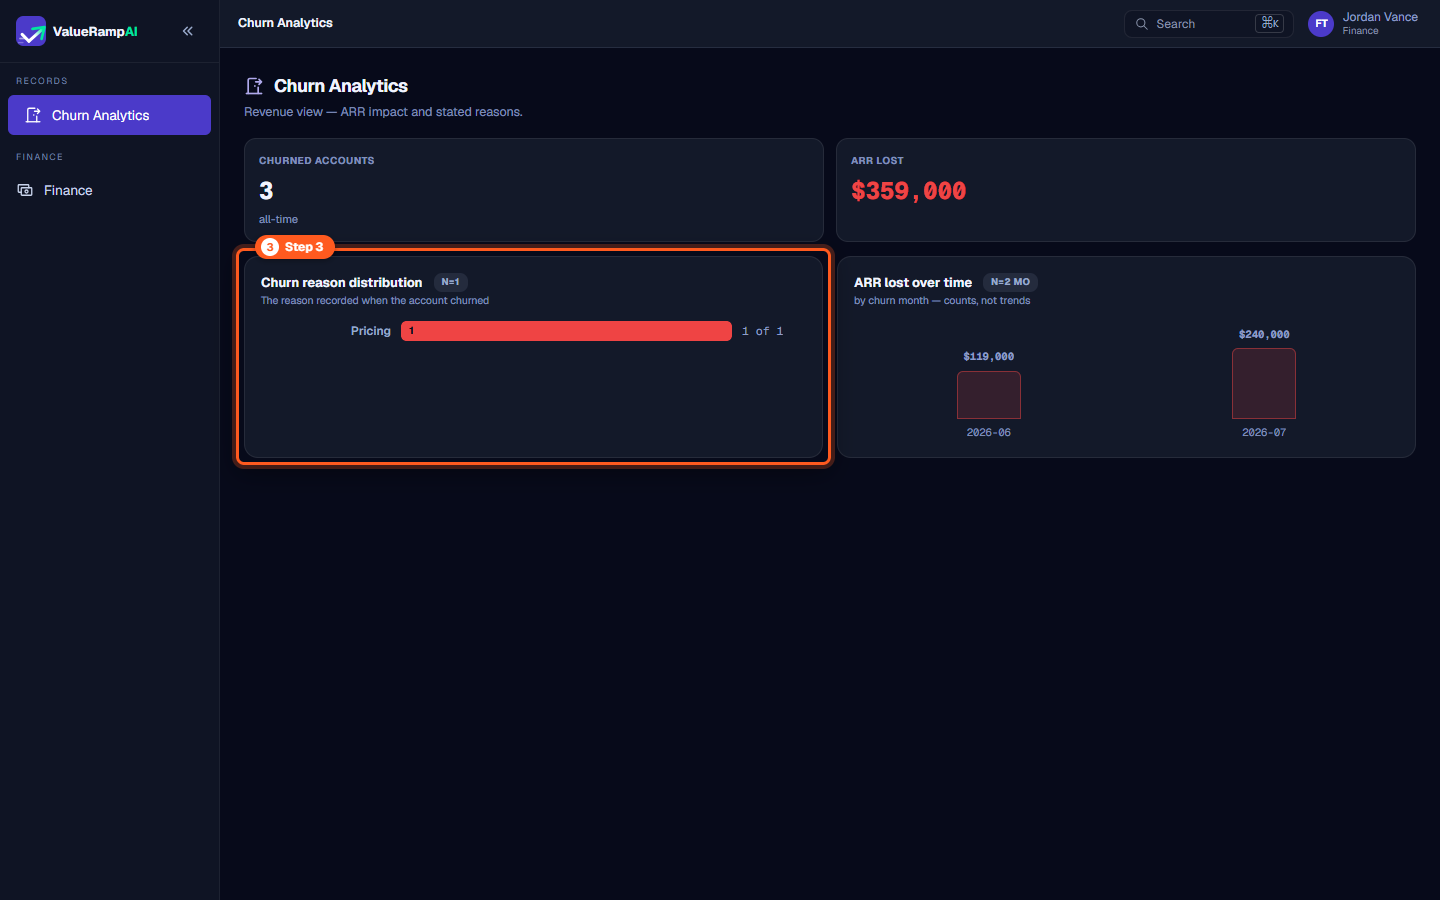
- Categorical reason analysis: Evaluate the Churn reason distribution — the reason recorded when each account churned.
- Cohort timeline visualization: Review the ARR Lost Over Time monthly distribution to detect seasonal spikes and fiscal quarter-end attrition patterns.
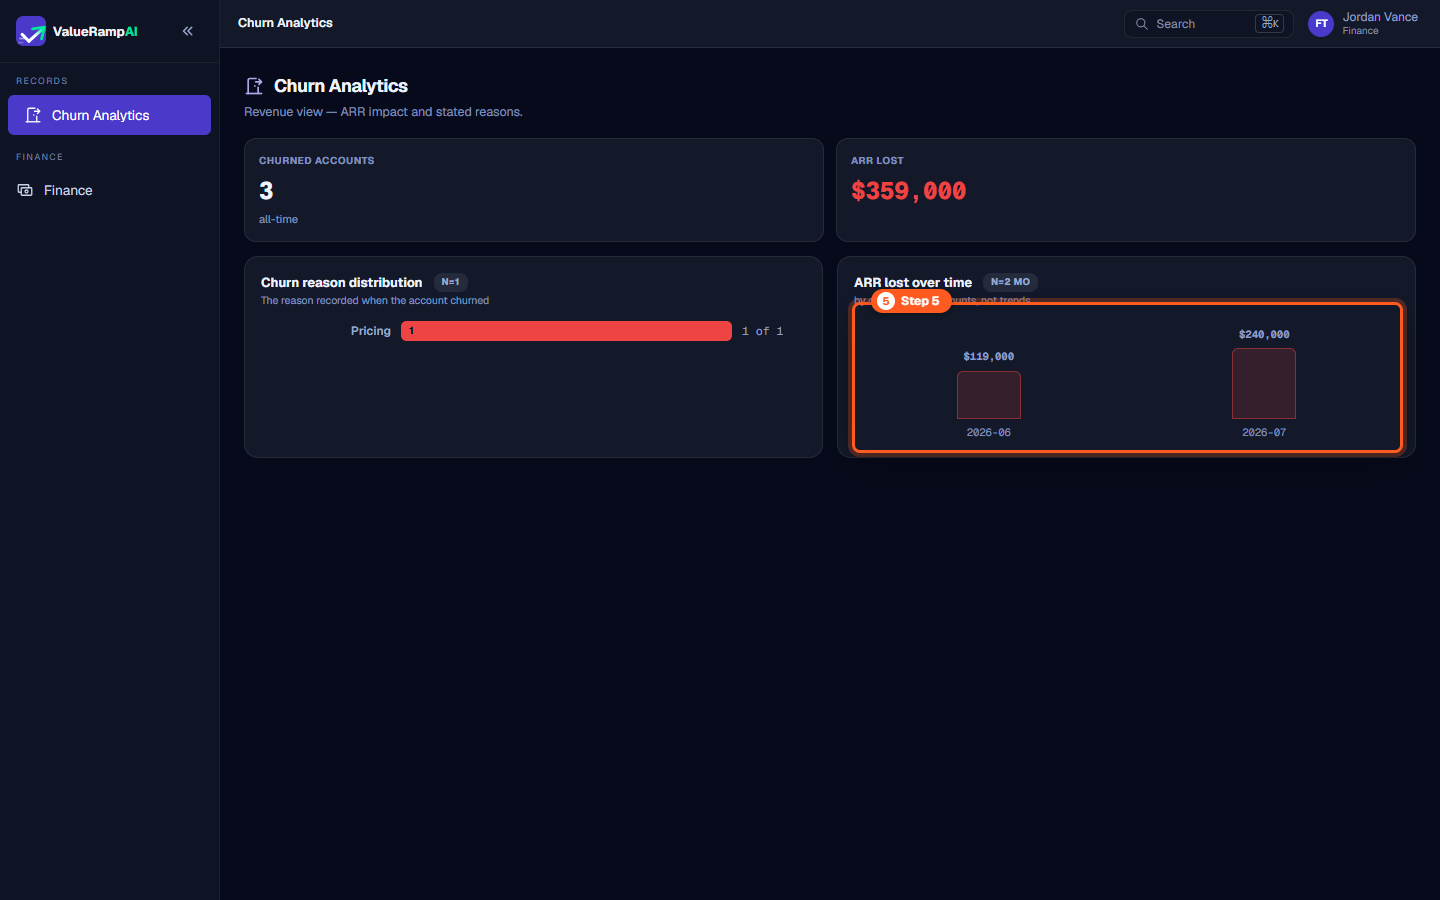
- Granular monthly figures: Inspect discrete monthly revenue loss tallies (e.g.,
$119,000in2026-06,$240,000in2026-07). - Revenue protection alignment: Correlate loss drivers with ongoing retention initiatives, ARR ledger entries, and win-back opportunities in the Reactivation pipeline.
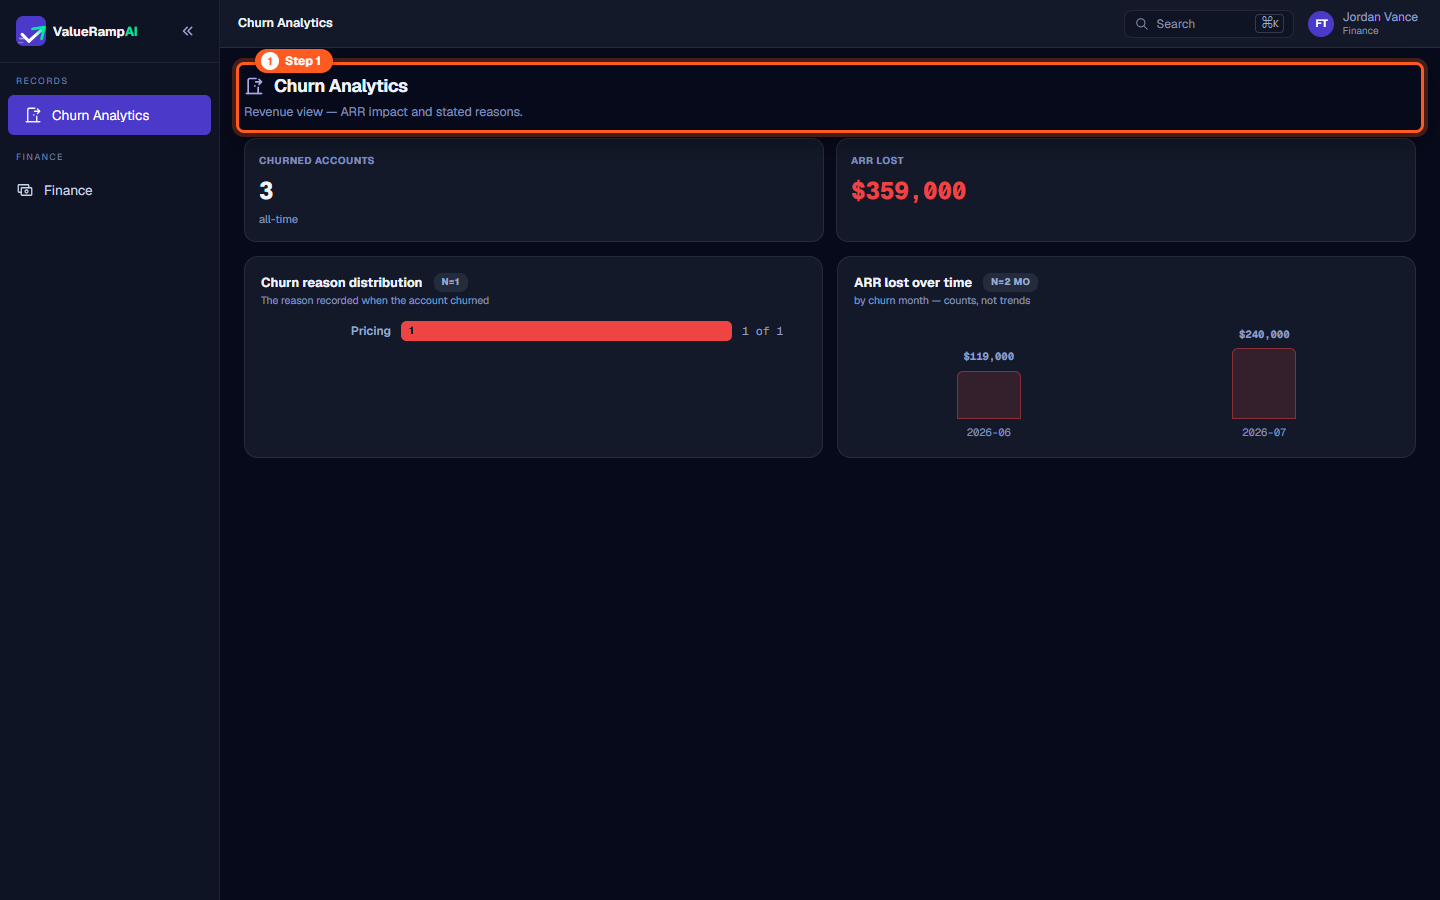
Step 1: Open Churn Analytics
- Open Churn analytics (
/analytics/churn) — available to Finance, Admin and CSM. - The page header defines the financial focus of the workspace:
"Revenue view — ARR impact and stated reasons."
- Use this view to ground churn discussions in exact contractual revenue figures rather than anecdotal feedback.
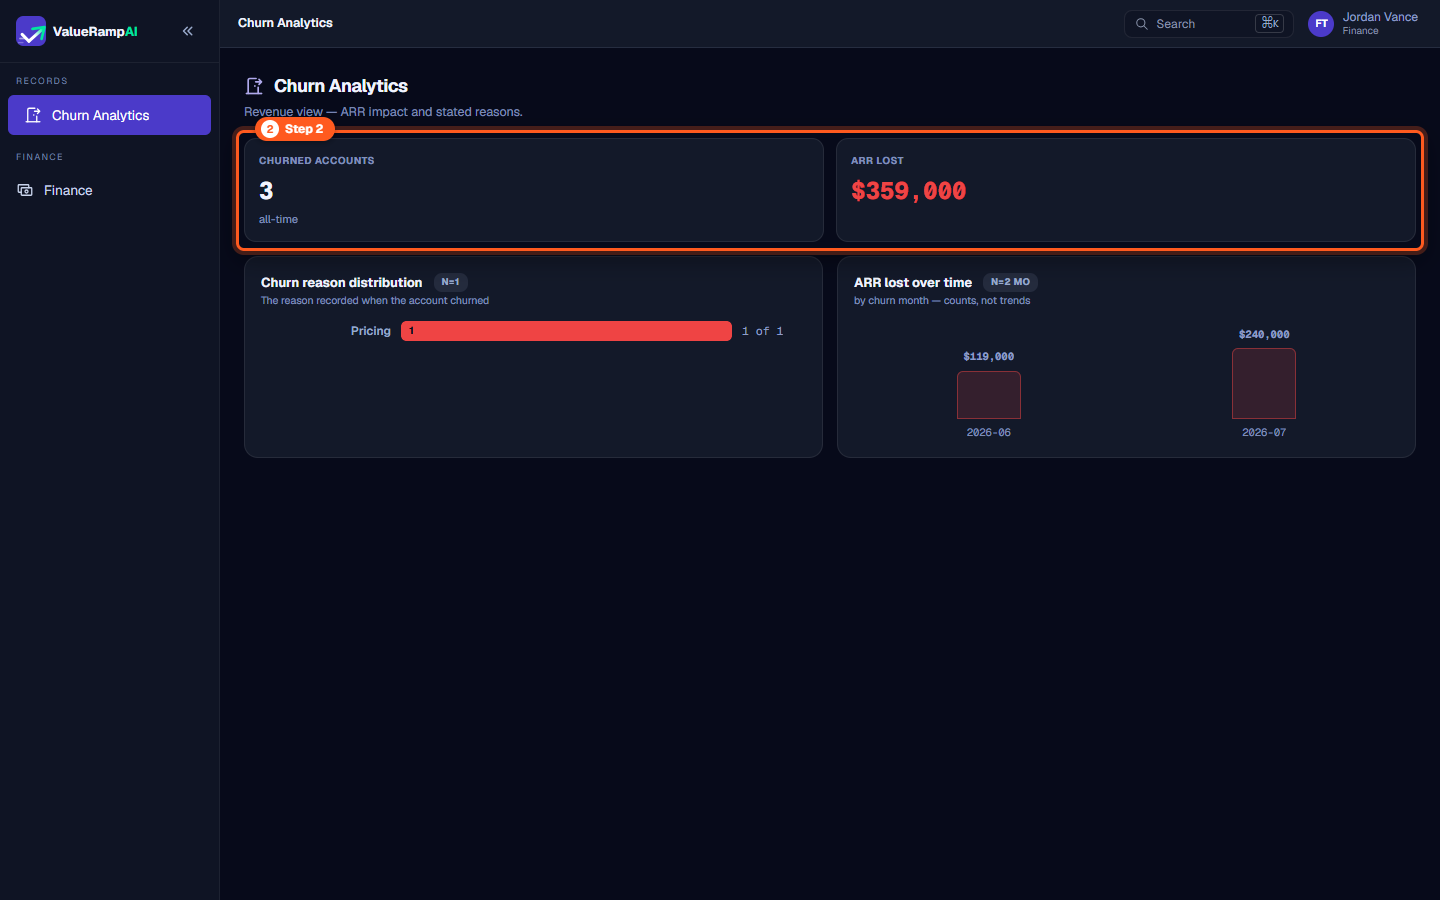
Step 2: Audit top-line churn KPIs
- Inspect the two primary summary metric cards at the top of the dashboard:
- CHURNED ACCOUNTS: The total number of customer accounts that have cancelled all-time (e.g.,
3 all-time). - ARR LOST: The aggregate Annual Recurring Revenue lost across all churned client contracts (e.g.,
$359,000).
- CHURNED ACCOUNTS: The total number of customer accounts that have cancelled all-time (e.g.,
- These metrics give Finance an immediate benchmark for gross revenue leakage.
Step 3: Analyze churn reason distribution
- On the left side of the dashboard, examine the Churn reason distribution panel:
- Header indicates the sample size of recorded reasons (e.g.,
N=1). - Subheader confirms: "The reason recorded when the account churned".
- Distribution bars display the recorded reasons (e.g., Pricing:
1, i.e.1 of 1recorded reasons). An account churned without a reason is counted in the KPI tiles but not here.
- Header indicates the sample size of recorded reasons (e.g.,
- Understanding whether revenue was lost due to commercial terms (pricing) or operational gaps helps Finance calibrate future contract discounting policies.
Step 4: Review ARR lost over time
- On the right side of the dashboard, inspect the ARR lost over time panel:
- Metric indicates time-series cohort coverage (e.g.,
N=2 MO). - Subheader notes: "by churn month — counts, not trends".
- Metric indicates time-series cohort coverage (e.g.,
- This chart plots churned dollars against their effective termination calendar month, illustrating when recurring revenue contracts expired.
Step 5: Evaluate discrete monthly revenue impacts
- Review individual monthly volume columns inside the timeline panel:
- 2026-06: Reflects
$119,000in churned contract ARR. - 2026-07: Reflects
$240,000in churned contract ARR.
- 2026-06: Reflects
- Cross-reference these monthly totals against the ARR Ledger (
/finance/arr-ledger) to verify individual churn delta entries and reconcile ending baseline ARR.
Steps
Open Churn Analytics to inspect customer cancellations and revenue attrition
Audit top-level churn metrics for total churned accounts and cumulative lost ARR
Examine the churn reason distribution to identify primary cancellation factors
Review the ARR lost over time panel evaluating churn volume across billing months
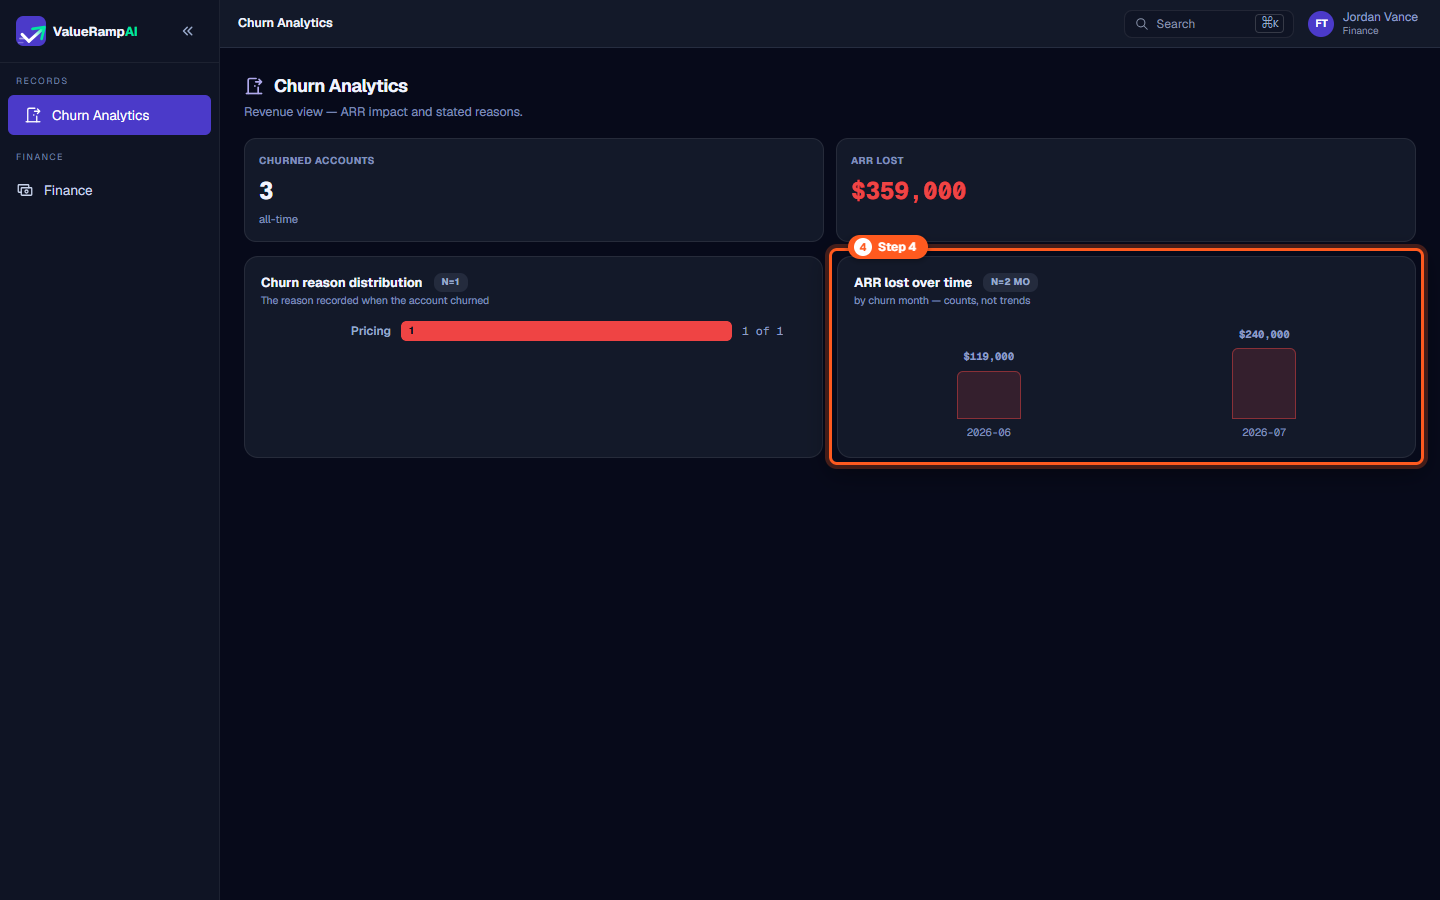
Analyze discrete monthly revenue attrition totals and month-by-month loss figures
Common questions
What does the Churn Analytics workspace provide for Finance teams?
Where do the churn reasons come from?
How is the 'ARR lost over time' chart grouped?
How does Churn Analytics connect to the Reactivation pipeline?
Was this helpful? Tell us what was missing